I recently got a chance to work with jMeter to stress test one of the Projects I was working on. jMeter is an open source software like all other Apache Projects. It is written in 100% pure Java and works as a desktop application. The installation is pretty easy and straightforward as well. Download the package and unzip it and that’s it. To run the application on Windows, double click the “bin/jmeter.bat” file and to run it on MacOS, double click the “ApacheJmeter.jar” file.
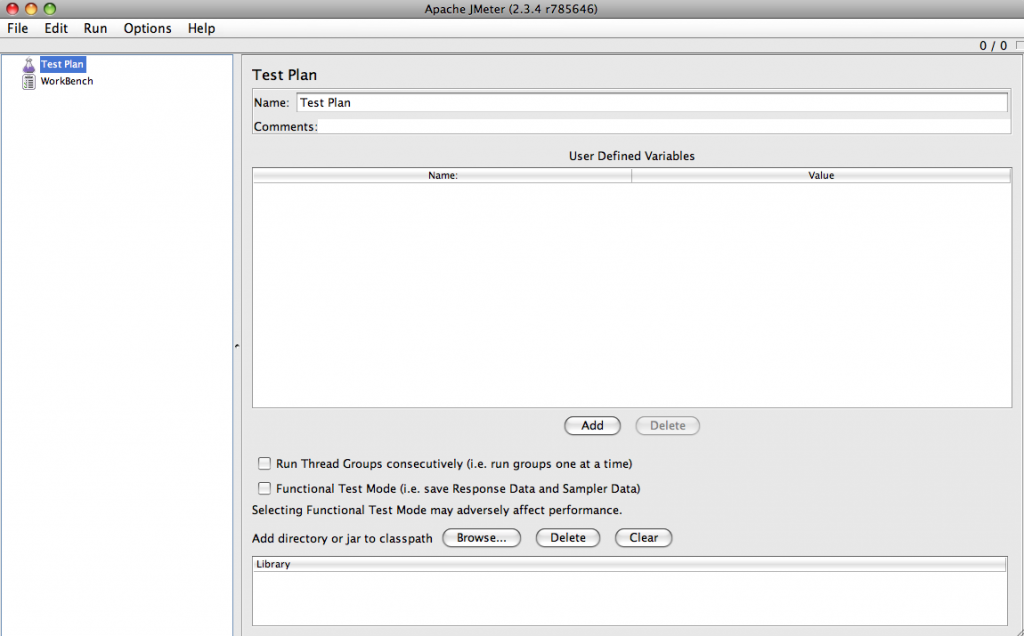
In this post, I will mainly describe the processes I followed to setup a Test Plan in jMeter. I think the learning curve with this application is very minimal, as once you understand what the basic terminology is, that’s pretty much it. At the top of the hierarchy is something called a ‘Test Plan’. This is what you add all your sub-actions to. Here is how the initial screen looks like once you have opened it up.
As you can see, there is already an empty Test Plan existing. You can now add elements to this Test Plan. jMeter allows for many different types of requests to be made including but not limited to HTTP Requests, FTP Requests, WebService Requests, SOAP Requests and many others. In this post, I am only going to concentrate on HTTP Testing. Although, once you get an idea, it should be pretty straightforward to do the others as well in a similar way.
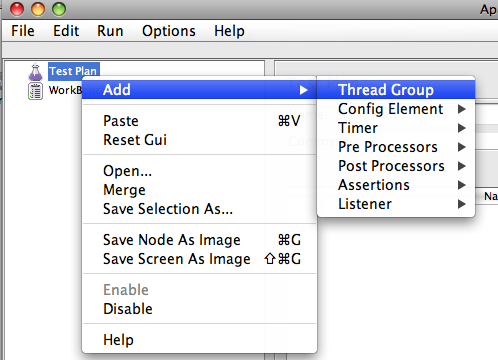
So, we start by adding a ‘Thread Group’ to our Test Plan. A Thread Group is something where you configure how many users you want to mimick. In other words, if I was to open xyz.com as a user in my browser, this Thread Group will do the same thing, the only difference is, you can tell it how many users you want to mimick and within what time span should those users hit the target URL. In the example below, I have got 5 users to hit the target within a timespan of 5 seconds.
You will see, I have called my Thread Group ‘WebTest’ in this example. To add a Thread Group, you simply right click on the Test Plan and add. Like this :-
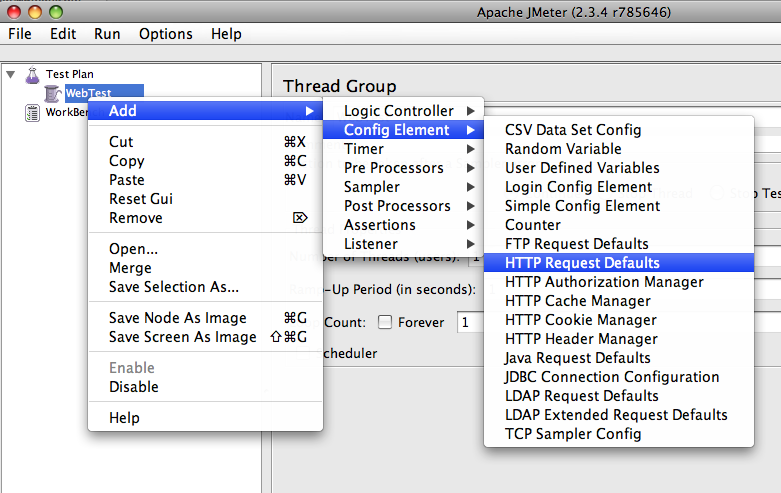
Once you added your Thread Group in, you can add your HTTP Request Defaults config element to it. This Config element does not make any requests to the target. It is simply a config element where you can define what the starting URL, Protocol, Port number, timeout etc to use. To add a HTTP Request Defaults, you simply do this :-
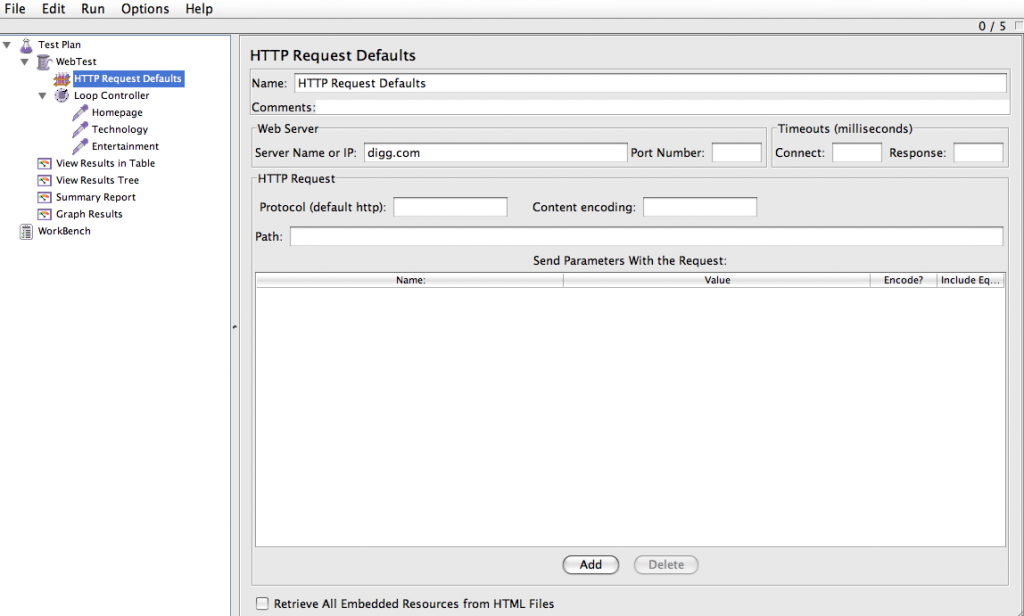
And once you have it added to your Thread Group, you can configure it like below :-
As you can see, for this example, I have told jMeter to use digg.com as the default URL for all HTTP Requests. I have left everything else blank, but if you wanted, you can configure Port, Protocol,timeout and any starting path here. e.g./start-from-here etc. There is also an option to send any URL parameters along (key-value pairs).
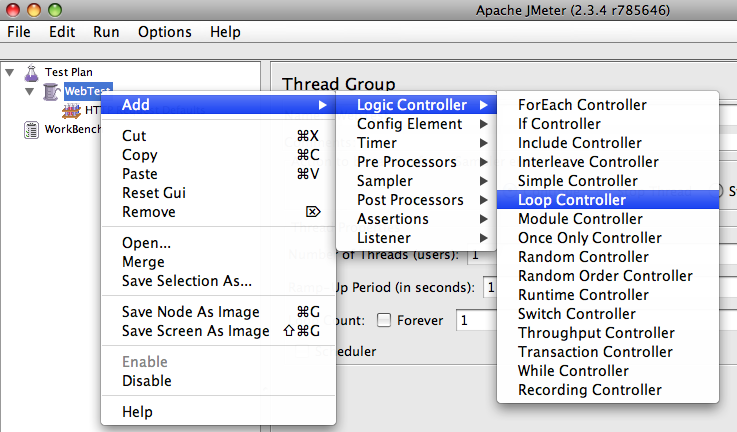
Now, the next thing I did was I added a Loop Controller to my Thread Group. A Loop Controller simply runs all its child elements one by one in order – and runs them the number of times you tell it to. There is also something called a Random Controller which does pretty much the same thing but does not do them in the specified order. Here is how you add the Loop Controller :-
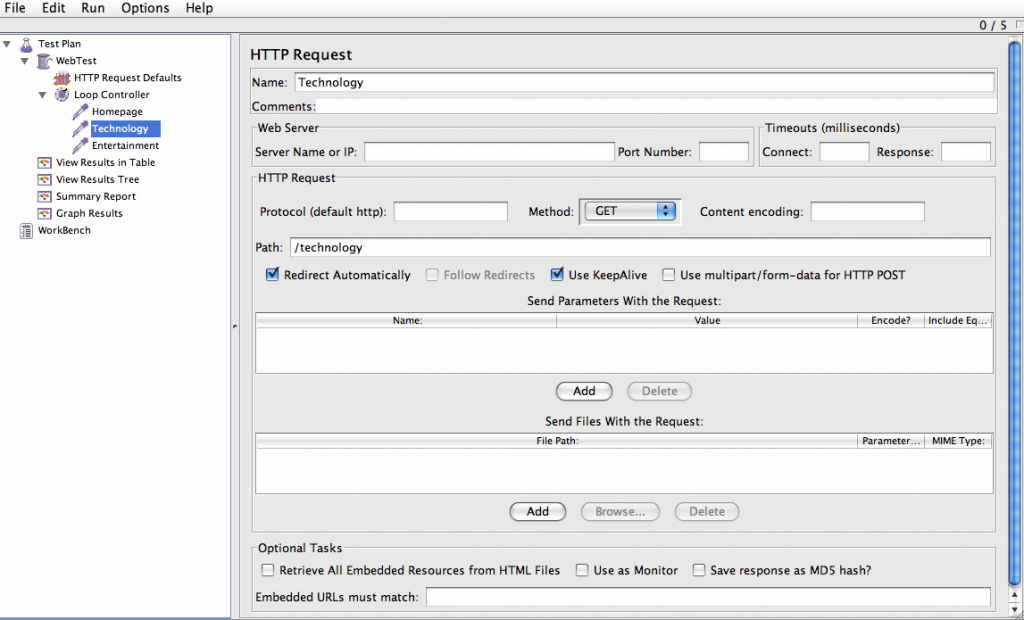
Now that you have the Loop Controller in, you can add as many Http Requests to the it. These are the requests that jMeter will execute as per the settings of the Loop Controller and the Thread Group. I have added 3 Http Requests in my Loop Controller, one for the HomePage, one for the Technology landing page and one for the Entertainment Landing page. But really, you can add as many as you want here. I would assume in a real scenario test, you will have a few more. Here is how my Technology Http Request looks like. Notice, how I have defined “/technology” in the Path. I have not given it the full URL because the initial starting URL (digg.com) comes from HTTP Request Defaults. This is where the Default settings come in handy.
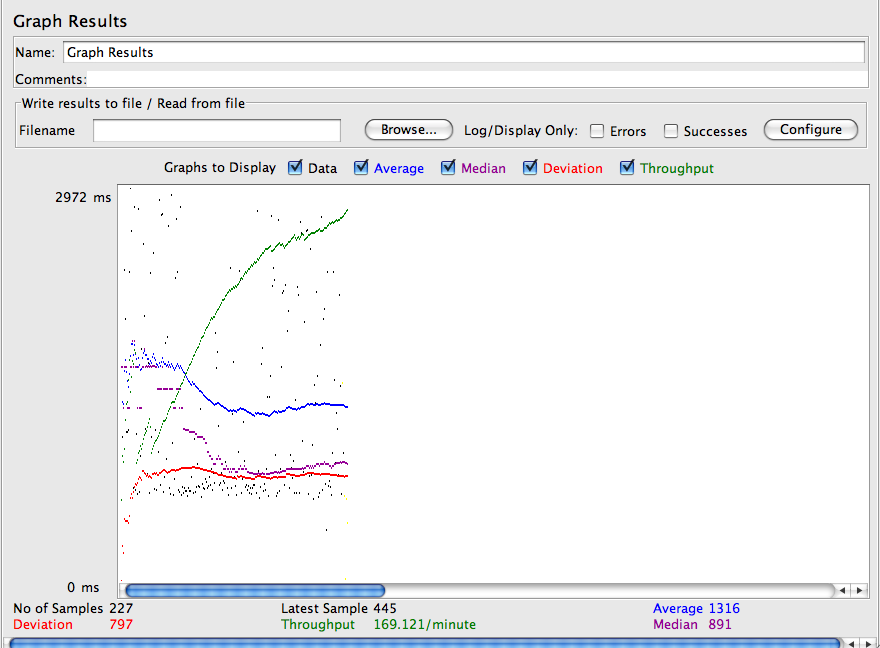
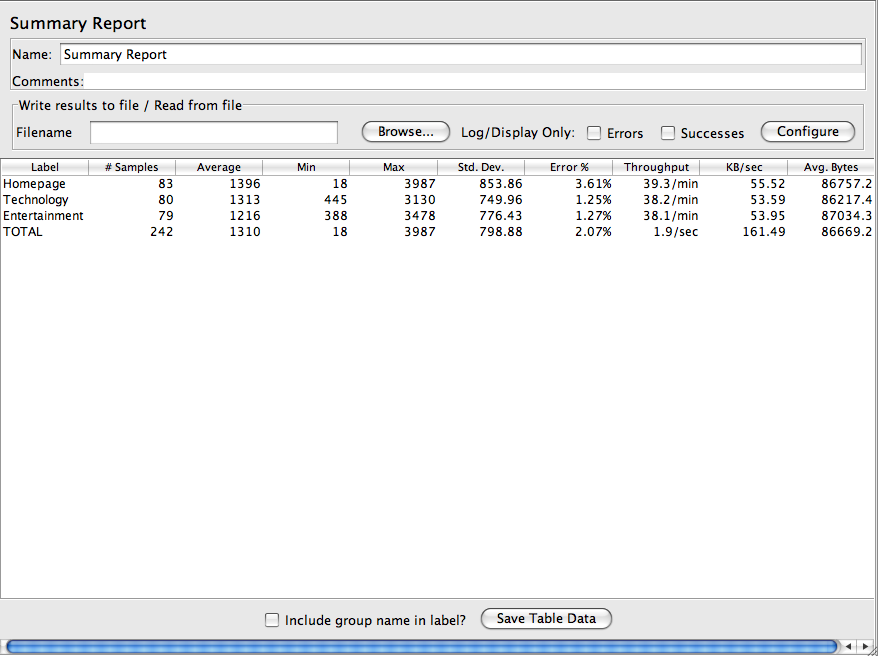
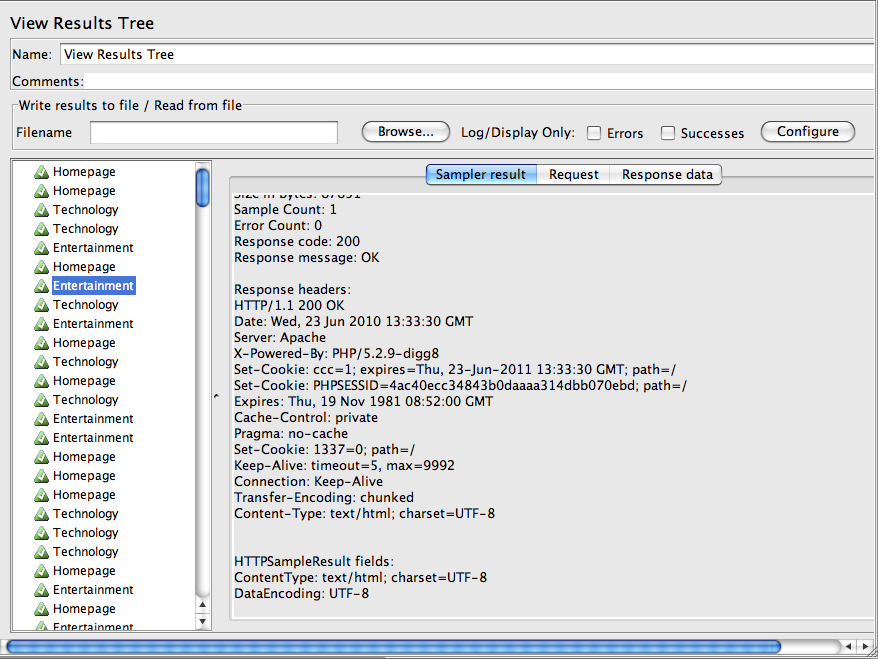
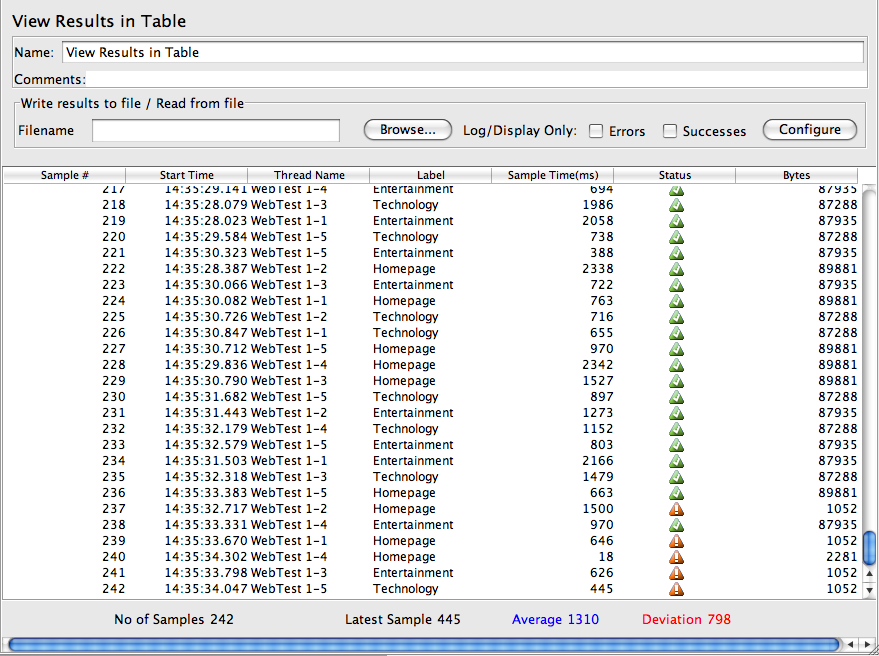
Now, that you have all your Http Requests in the Loop, we simply need a way of looking at the test results. And for that, we need to add some ‘Listeners’ to our Thread group. There are quite a few Listeners in there and they all capture exactly the same data, the only difference is how they treat the data. Each Listener has its own purpose and analyses the data differently. I have added 4 Listeners to my Test Plan above. ‘View Results in Table’, ‘View Results Tree’, ‘Summary Report’ and ‘Graph Results’. The process of adding these to your Test Plan is the same. Right Click on the Thread Group and add Listeners.
That’s it. The Test Plan is ready. We can now run the Test Plan and if everything has been setup properly, we should see the data coming in the Listeners. To run your test, click on the Run Menu and then Start. There are keyboard shortcuts for each of these menu items as well. Once I run the Test, I can see the data in my Listeners as follow :-
If you want, you can add more Listeners as well. You can also save the results to a file and save for future reference. The results are pretty clear to understand as you can see what works and what fails under what kind of stress. Normally, I would test a website for 10 users within a span of 20 seconds and if I dont get any errors, I would call the test a success. But these numbers can vary for different requirements and different server infrastructures.
This was a very simple Test Plan which involved nothing but 3 HTTP Requests mimicked as 5 users in 5 seconds. But you must have seen, that there is so much more you can do with it. You can test your FTP server settings with an FTP Request. You can test your Web Services with a Web Service Request. And so on….
It took me not more than half an hour to install and get used to and have my first Test Plan ready. And then another hour or 2 to get accustomed to jMeter terminologies and functionalities. I am liking it very much, indeed.



We have updated our JMeter blog with new materials(http://blazemeter.com/blog).
There are a lot of articles. On of them is related to results analyzing – http://blazemeter.com/blog/how-analyze-results-large-scale-load-test
LoadFocus – https://loadfocus.com – launches today the cloud load and performance testing service powerful enough to stress a web application or API with thousands of concurrent users.
Based on Apache JMeter open source project and hosted in the cloud, LoadFocus is designed for software developers, QA (Quality Assurance) engineers and product owners to run accurate load and performance tests with minimum costs
Data you provided, is really helpful..
Thanks
Hi, Anuj
I am puneet working as load tester from last 2 month and I was facing an issue that when i performed load testing on site like flipcart, yahoo site . it gives me a higher response time to me eg. 36, 30,40, 45 sec. which is not acceptable for me for preparing report.
the step i have followed that are:-
1) First add thread group and Record the script of home, search page.
2) Put both script in two transaction controllers and mark as generate as parent .
3) Add tree view, summary result, and other controllers.
4) Run the test.
could please help me in this regard for solving these problem.
thanks in advance.
Regards,
Puneet Jain
Puneet, do you get higher response time for all websites or just the ones you mentioned? If it is for all websites, then there maybe something wrong in the way you setup the jMeter script.
hi puneet jain,
i want to do load testing of webiste can u help me.
can you give me your contact of linkedin or whatsapp to communicate. my contact 9717163536
Very nice …..Helped me to configure one test case easily .
Thanks
wr do u work? in bangalore?
loool. ladkine comment kiya .. wer do u wrk… nalayak.. 😛
i try with above steps but it’s not display proper result it’s display warning in “View Result in Table” , “View Result Tree”. and also Error% in “Summary Report” display 100%…so please any one explain what was the problem.
sdf
hi Anuj,,
please let me know if you are in bangalore or if u provide some training..i am working on a proj using jmeter not able to analyse the results properly.
Look forward to your help
I am not in Bangalore I live in the UK and don’t provide any training, sorry.
Hi Anuj,
Thanks to post such a nice steps to learn the Stress Testing on JMeter.
HI Anuj,
Thank you for the breif steps .. i could run the scripts @ first shot following the steps of here…
Thanks. !!
I am trying to run the Load test for my company website.
How do I setup Loop Controller, so that I am entering the login credentials and test the load for the website after logging in to the website.
Thanks in advance!
Excellent Post. Also visit http://whiteboxqa.com/#performance.php
Hello Sir , I am beginer on j meter .
But i need to test a website so how would i start ?
how to write test cases for a website .
Please help me .
Vishal you can follow the article and start testing. It should work for any website.
Hello Anuj,
I am trying to use Jmeter. I have tried few things like how to build test cases n all. But i wann test the software thn what should i do the next? can u plz help me.
What kind of software? Jmeter is for stress testing websites and maybe databases. Not sure how you can test a desktop based software with jmeter.
Hi Anuj,
Thnx for ur reply. Its an eLMS Software & I would like to know about the steps to create the Test Plans for Login.
Hi Anuj,
I have tried to load test my URL:
http://www.screenerwebservice.test.idmanagedsolutions.com/WSScreener/rest/GetScreenerMeta/1/2
Here WSScreener is the Webservice, GetScreenerMeta is a method of Webservice, 1 and 2 are parameters.
it is not running.
Any clue?
Thanks
Abid
You can find more details on Apache JMeter Load and Performance testing here: http://loadfocus.com/blog/2013/07/apache-jmeter-performance-test-introduction/
i need basic follow for recording log in page using j meter. i have searched in online but those aren’t working. can you please explain how to record the log in page with j meter?
Hi,
Thanks for post. I try this way very easy..
I follow this performance testing our web based application projects.. Can you tell me ? this way will be give to good results our projects…
This is the advanced level to do performance testing…
else can u post next level how to do performance testing using jmeter?
….
..
Krishna
Nice article Anuj… but how we can analyze the results in jmeter,while testing i got 8.40% error in aggregate report what does that mean..?
Hi. I have a question, How I can do that on my web local applocation such a “localhost:8080/SISTRADO”?
hai,its a nice article…Can you explain the graph,and can u give example for filling an form through jmeter and getting to know abut the performance of the page.
How can we do stress and load testing in jmeter? i need a separate test case for both. we can increase threads and loops.
hi anuj,
How to handle security question while login on UI via jmeter